Key Metrics Comparison
| Metric | Buy | Rent |
|---|---|---|
| Avg Price | $221.6k | $40/mo |
| Price-to-Rent Ratio | 461.7years of rent | |
| Monthly Payment | $1.1kat 6.5%, 20% down | $40 |
| Break-Even Horizon | 21 years | |
| Est. Buy-to-Let ROI | 0.2% | |
Interactive Calculator
Adjust the numbers to match your situation and see how buying compares to renting over time.
Rent is better
Purchase price of the home
Share of the home price paid upfront
Annual mortgage interest rate
Mortgage term in years
Current monthly rent for a comparable home
Expected annual home price growth
10 years
Monthly Mortgage
$1,121
Home Value After 10 Years
$297,862
Break-Even
21 years
Cost Comparison After 10 Years
Total Cost (Buy)$31,268
Total Cost (Rent)$4,800
Net Difference$-26,468
Renting is cheaper by $26,468 over this period.
Top Rent Listings in Al Kharj
View all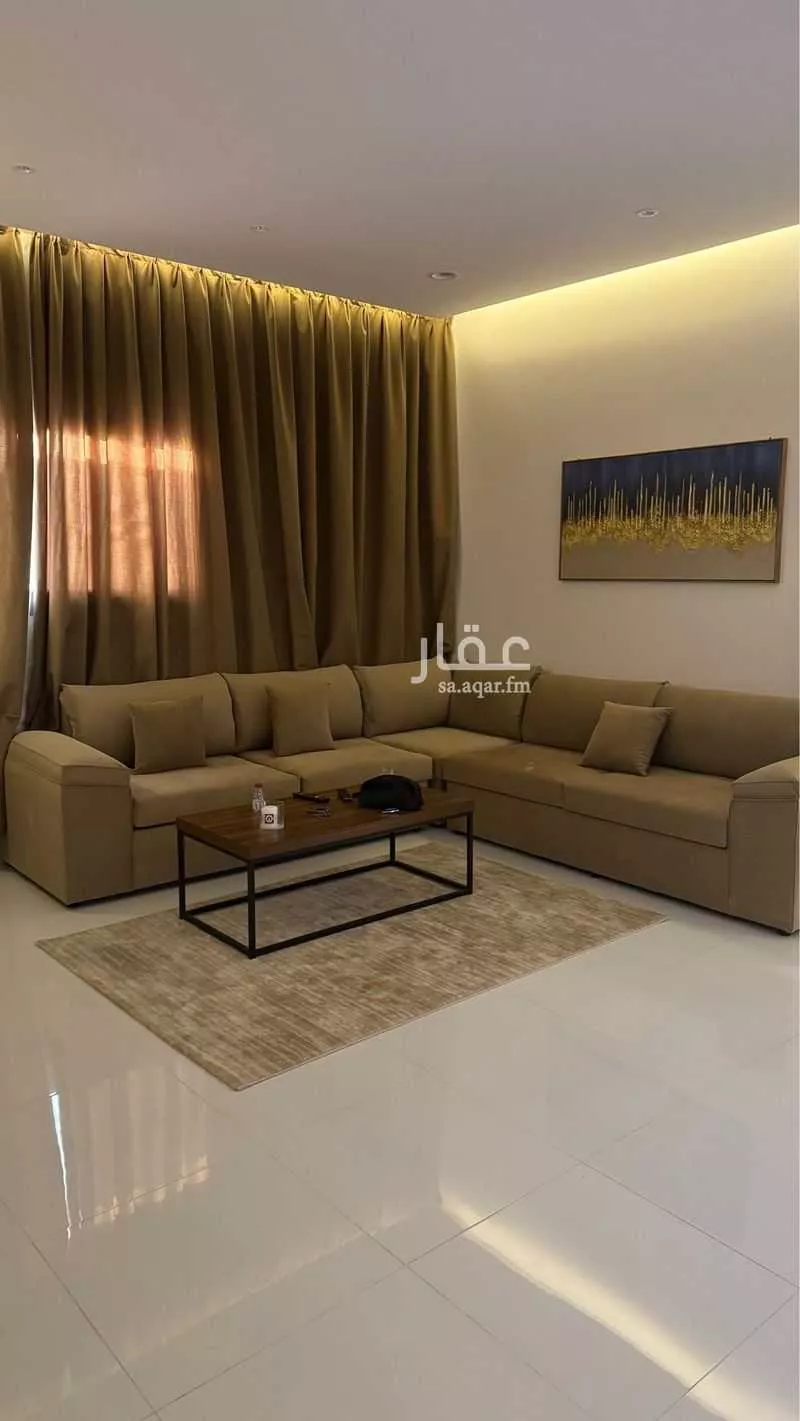
Market Context
Sale Listings0
Rent Listings1
Avg Sale $/m²$479/m²
0This is an estimate. Consult a financial advisor before making any real estate decision.