Top Districts in Aalborg
| District | Listings | Avg $/m² | Avg Score | Top Score |
|---|---|---|---|---|
| Hals | 200 | $1,919 | 53.6 | 73.9 |
| Nørresundby | 173 | $3,106 | 51.4 | 68.3 |
| Storvorde | 114 | $1,715 | 54.6 | 71.2 |
| Nibe |
AI-scored apartment deals in Aalborg, Denmark. Currently tracking 1,602 active listings.
For Sale
1,602
listings
For Rent
—
none listed yet
Avg Buy Price/m²
$2.7k
USD
Avg Rent/mo
—
USD
| District | Listings | Avg $/m² | Avg Score | Top Score |
|---|---|---|---|---|
| Hals | 200 | $1,919 | 53.6 | 73.9 |
| Nørresundby | 173 | $3,106 | 51.4 | 68.3 |
| Storvorde | 114 | $1,715 | 54.6 | 71.2 |
| Nibe |
| 92 |
| $2,003 |
| 55.8 |
| 73.3 |
| Aalborg SØ | 75 | $2,894 | 50.6 | 65.5 |
| Vodskov | 69 | $2,038 | 55.0 | 70.4 |
| Aalborg SV | 64 | $2,871 | 53.2 | 71.7 |
| Svenstrup J | 61 | $2,491 | 54.7 | 71.3 |
| Gistrup | 47 | $2,608 | 54.8 | 71.1 |
| Gandrup | 40 | $1,411 | 57.4 | 68.3 |
| Kongerslev | 29 | $1,022 | 57.0 | 70.1 |
| Aalborg Øst | 19 | $2,198 | 55.2 | 70.2 |
| Klarup | 18 | $2,418 | 55.0 | 69.3 |
| Vestbjerg | 18 | $2,623 | 55.1 | 67.5 |
| Vadum | 16 | $1,914 | 54.1 | 66.7 |
| Tylstrup | 12 | $1,097 | 56.0 | 68.7 |
| Sulsted | 9 | $1,609 | 57.7 | 69.3 |
| Støvring | 5 | $3,188 | 54.8 | 66.3 |
603 listings
View all 1,602 listings on an interactive map with filters, AI scores, and district analytics.
Explore deals in AalborgInternal links to high-scoring active listings improve discovery and help users move from market research to real properties.
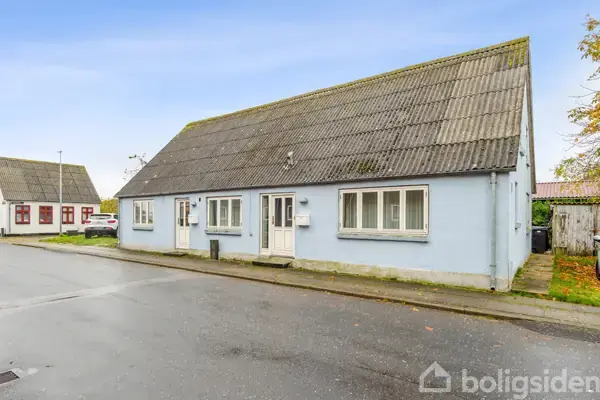
$149,250 · 198 m² · 9 rooms
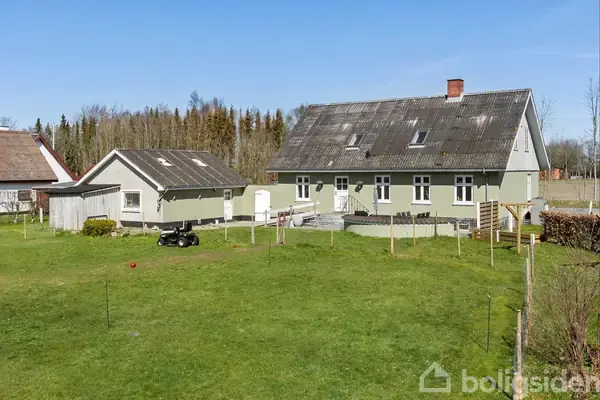
$116,250 · 202 m² · 7 rooms

$329,250 · 486 m² · 15 rooms
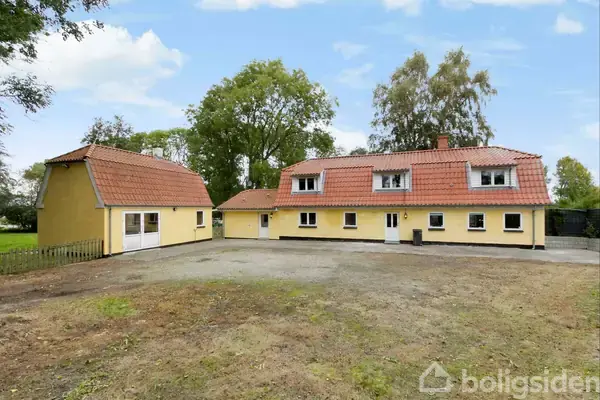
$216,750 · 244 m² · 8 rooms
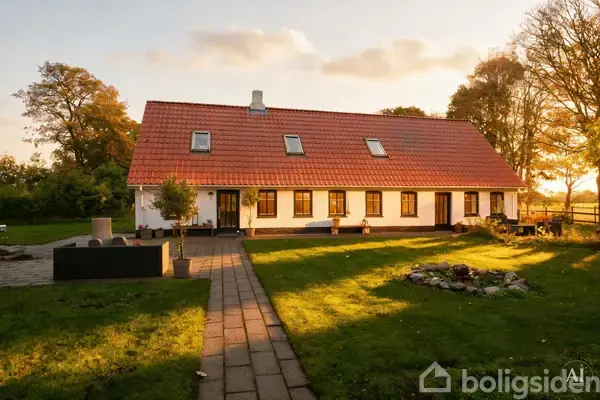
$192,750 · 200 m² · 7 rooms
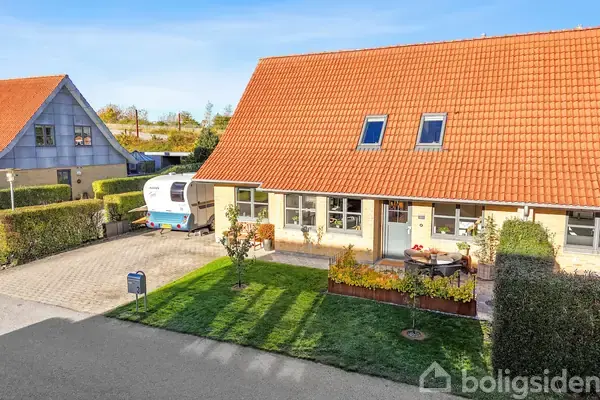
$186,750 · 158 m² · 5 rooms
DomusEmpire tracks and analyzes real estate listings in Aalborg, Denmark in real time. Our AI scoring system evaluates every apartment across 10+ factors including price per square meter, comparable pricing, metro proximity, building quality, floor positioning, and layout efficiency.
There are currently 1,602 properties for sale with an average price of $2,732/m².
Each listing receives a deal score from 0 to 100, helping you identify the most attractive opportunities. Higher-scored properties represent better value relative to their district and comparable listings.