Top Districts in Abu Dhabi
| District | Listings | Avg $/m² | Avg Score | Top Score |
|---|---|---|---|---|
| Al Reem Island | 1215 | $6,908 | 53.3 | 69.2 |
| Saadiyat Island | 103 | $6,442 | 48.9 | 63.7 |
| Yas Island | 42 | $7,468 | 56.4 | 65.7 |
| Khalifa City | 19 | $11,230 | 52.5 | 62.5 |
| Al Maryah Island | 11 | $6,117 | 60.7 | 66.4 |
| Al Raha Beach | 7 | $14,725 | 54.1 | 58.1 |
| Al Shamkha | 5 | $15,201 | 48.0 | 54.3 |
Price Distribution (Sale)
Score Distribution
Property Types
616 listings
Browse by Price
Rental Market in Abu Dhabi
Rentals
8,945
Avg Rent/mo
$3.6k
Avg Rent $/m²
$185
Avg Score
44.1
Pagine correlate
Best listings in Abu Dhabi
Internal links to high-scoring active listings improve discovery and help users move from market research to real properties.

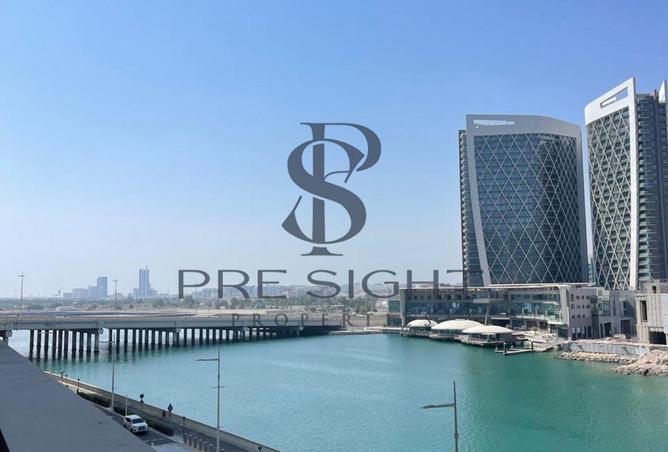
About Abu Dhabi Real Estate Market
DomusEmpire tracks and analyzes real estate listings in Abu Dhabi, United Arab Emirates in real time. Our AI scoring system evaluates every apartment across 10+ factors including price per square meter, comparable pricing, metro proximity, building quality, floor positioning, and layout efficiency.
There are currently 4,737 properties for sale with an average price of $7,008/m². The rental market includes 10,053 listings with an average monthly rent of $3,582.
Each listing receives a deal score from 0 to 100, helping you identify the most attractive opportunities. Higher-scored properties represent better value relative to their district and comparable listings.