Houses by District in York
| District | Listings | Avg $/m² | Avg Score | Top Score |
|---|---|---|---|---|
| York | 132 | $5,742 | 55.6 | 71.5 |
| Warlingham | 37 | $10,147 | 49.3 | 65.9 |
| York YO10 | 16 | $2,230 | 60.6 | 68.1 |
| Surrey | 16 | $10,046 | 44.5 | 67.6 |
AI-scored houses deals in York, United Kingdom. Currently tracking 358 active houses listings.
Listings
358
Avg Price
$668.6k
Avg Price/m\u00B2
$6,684/m²
Avg Score
53.7
| District | Listings | Avg $/m² | Avg Score | Top Score |
|---|---|---|---|---|
| York | 132 | $5,742 | 55.6 | 71.5 |
| Warlingham | 37 | $10,147 | 49.3 | 65.9 |
| York YO10 | 16 | $2,230 | 60.6 | 68.1 |
| Surrey | 16 | $10,046 | 44.5 | 67.6 |
| York YO32 | 12 | $6,338 | 55.5 | 72.3 |
| YO31 | 9 | $6,395 | 54.9 | 66.3 |
| YO30 | 9 | $5,846 | 59.9 | 70.8 |
| York YO24 | 9 | $5,341 | 60.5 | 71.7 |
| YO23 | 6 | $7,963 | 54.5 | 67.6 |
| YO24 | 6 | $6,412 | 50.8 | 63.2 |
| YO26 | 5 | $7,646 | 53.9 | 65.4 |
Best-scoring active houses listings.
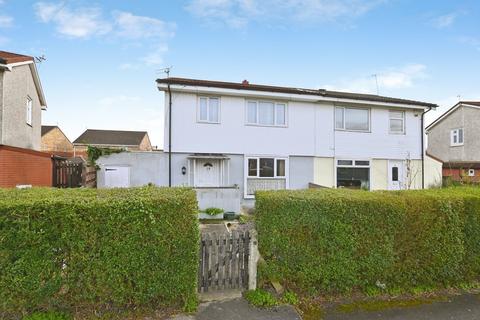
$224,400 \u00B7 85 m\u00B2 \u00B7 3 rooms

$99,000 \u00B7 65 m\u00B2 \u00B7 2 rooms
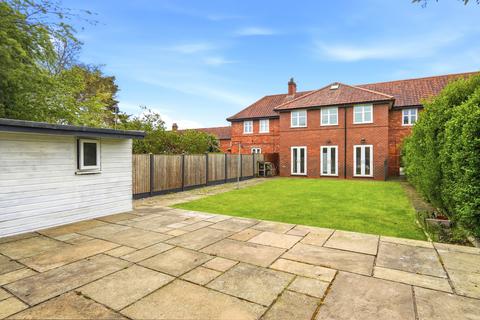
$448,800 \u00B7 110 m\u00B2 \u00B7 4 rooms

$297,000 \u00B7 85 m\u00B2 \u00B7 3 rooms
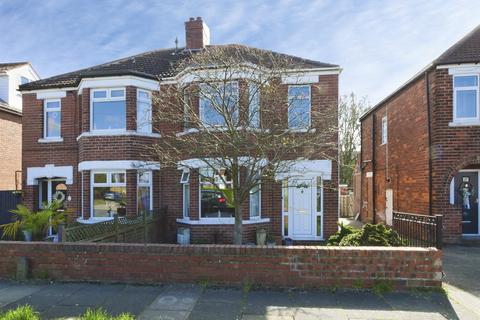
$264,000 \u00B7 85 m\u00B2 \u00B7 3 rooms
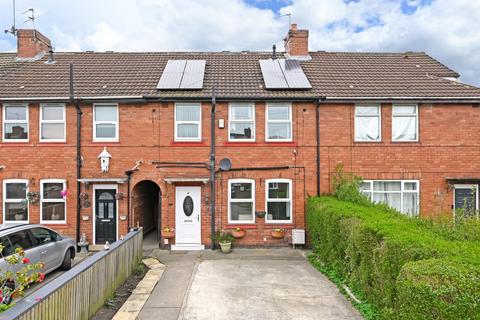
$323,400 \u00B7 85 m\u00B2 \u00B7 3 rooms
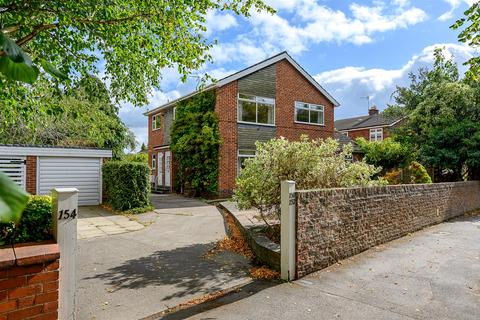
$501,600 \u00B7 140 m\u00B2 \u00B7 5 rooms
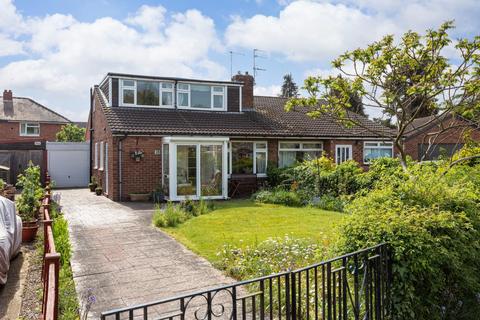
$382,800 \u00B7 110 m\u00B2 \u00B7 4 rooms
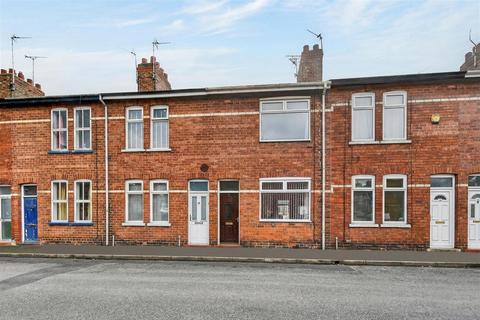
$290,334 \u00B7 85 m\u00B2 \u00B7 3 rooms
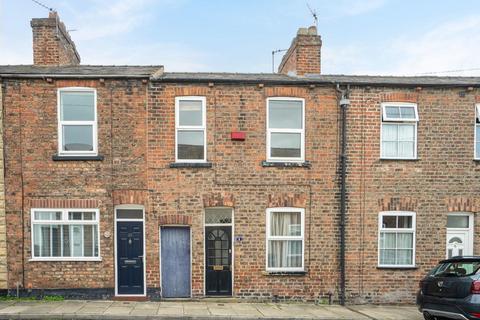
$290,400 \u00B7 85 m\u00B2 \u00B7 3 rooms
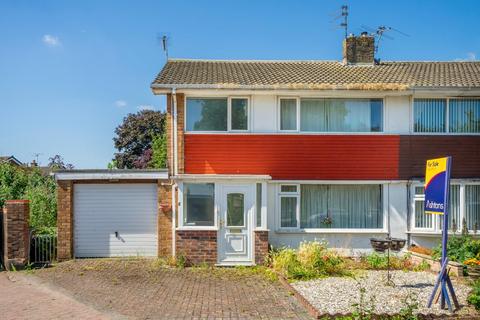
$396,000 \u00B7 110 m\u00B2 \u00B7 4 rooms
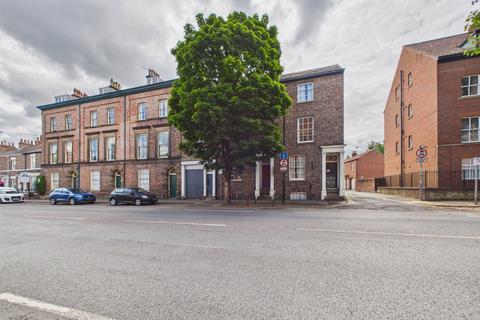
$561,000 \u00B7 165 m\u00B2 \u00B7 6 rooms
View all houses listings on an interactive map with filters, AI scores, and district analytics.
Open mapDomusEmpire tracks and analyzes houses listings in York, United Kingdom in real time. Our AI scoring system evaluates every property across price per square meter, comparable pricing, location signals, and building quality.
There are currently 358 houses listings for sale, with an average price of $6,684/m².
Each listing receives a deal score from 0 to 100, helping you identify the most attractive opportunities. Higher-scored properties represent better value relative to their district and comparable listings.